Google Analytics 4: How To Build a Custom Report
By Tomahawk on
If you have some metrics that you prefer to see in Google Analytics reports but there's not one report that provides exactly what you are after, you can create your own customised report using the new "Explore" tab in GA4.
While this may seem like an advanced feature, it's not as complex as it sounds! The best way to discover how to do it is by simply trying to create one yourself. We are providing this step-by-step guide to help get you started, once you have the hang of it you will find this a valuable feature of GA4.
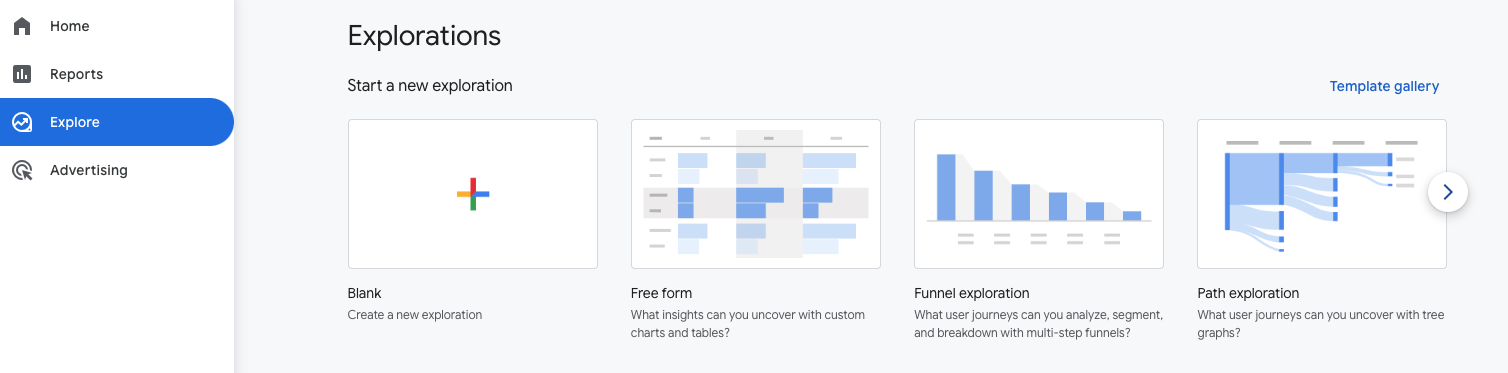
Step 1: The Explore Tab
The first task is to go to the Explore tab, it's found in the left-hand navigation bar that pops out. Then, select "Free form".
You can use the blank option too however the Free Form is a great one to start with for your first try as it populates the report with some data. This makes it easier to go through each step if there are already options presented to you.
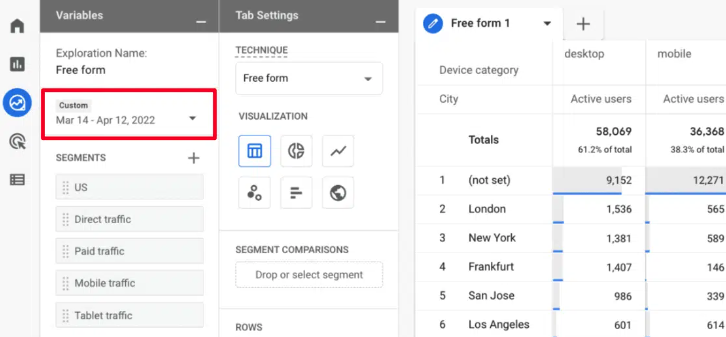
Step 2: Choose a Date Range
By default if will be the last 30 days - other ranges include the last 7 days, the last 28 days, the quarter to date and so on, or you can choose a custom range. You can also select to compare to previous periods.
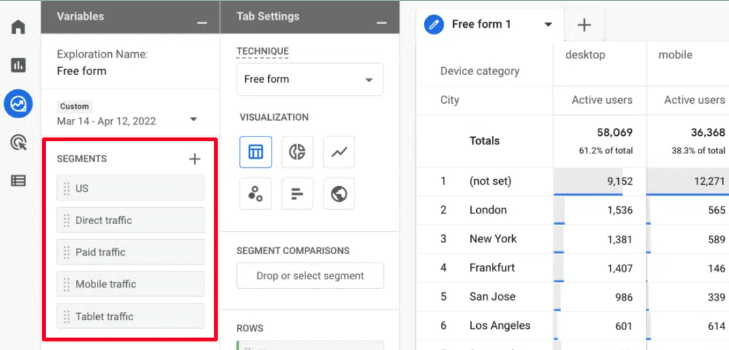
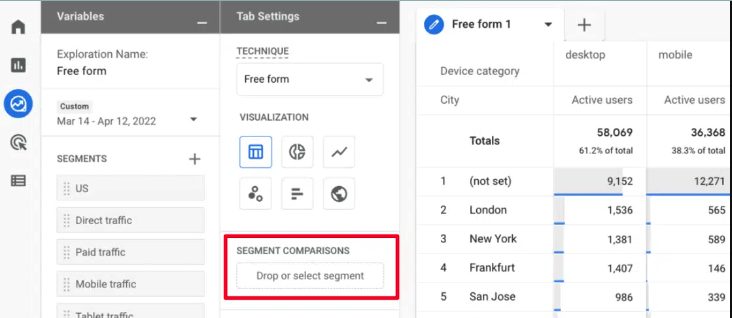
Step 3: Add Segments to compare traffic (optional)
Segments in GA4 are the same as in Universal Analytics. Segments are ways of putting your traffic into categories to view on it's own, or to compare with another segment.
Examples:
- Traffic from a certain country, region or city
- Mobile or desktop traffic
- Users who made a booking
- Traffic from a certain channel (paid, organic, social)
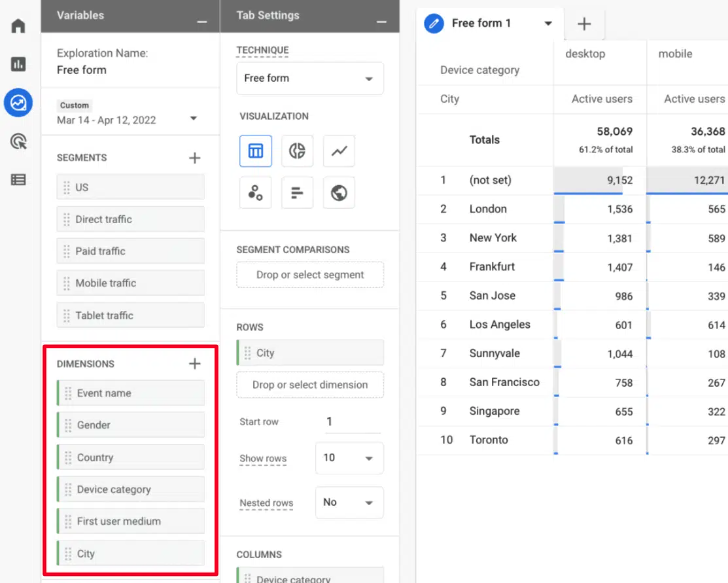
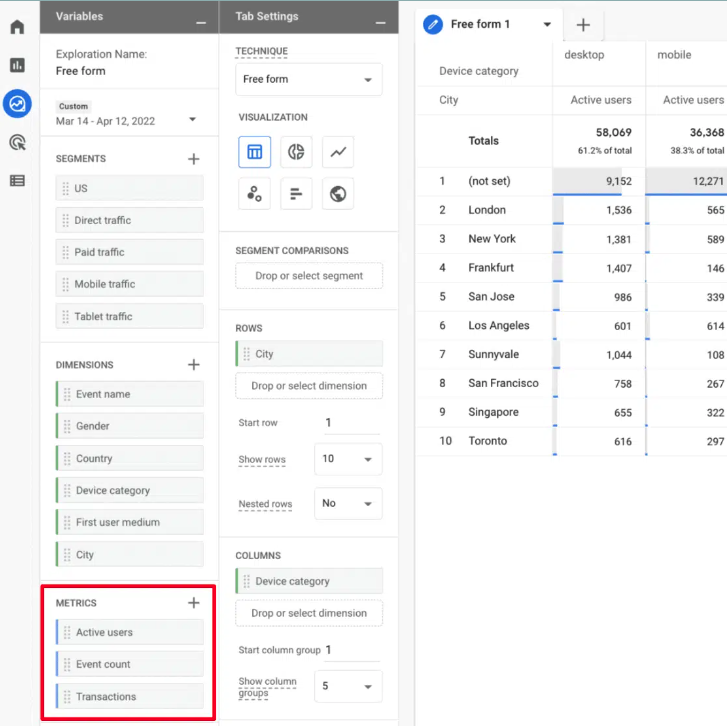
Step 4: Add Dimensions
Add any dimensions you might want in your report. These are things like: Event name, Campaign, Gender, Age, Interests, or Page location.
Step 5: Add Metrics
This is where you choose what numbers you want to see about the dimensions you picked. You might want to see users, views, or purchases, for example.
Step 6: Drag & Drop Segments
Now that you’ve selected variables for your report, you can drag and drop them to where you want them to go. If you created any segments, drag those over to the Segment Comparisons box.
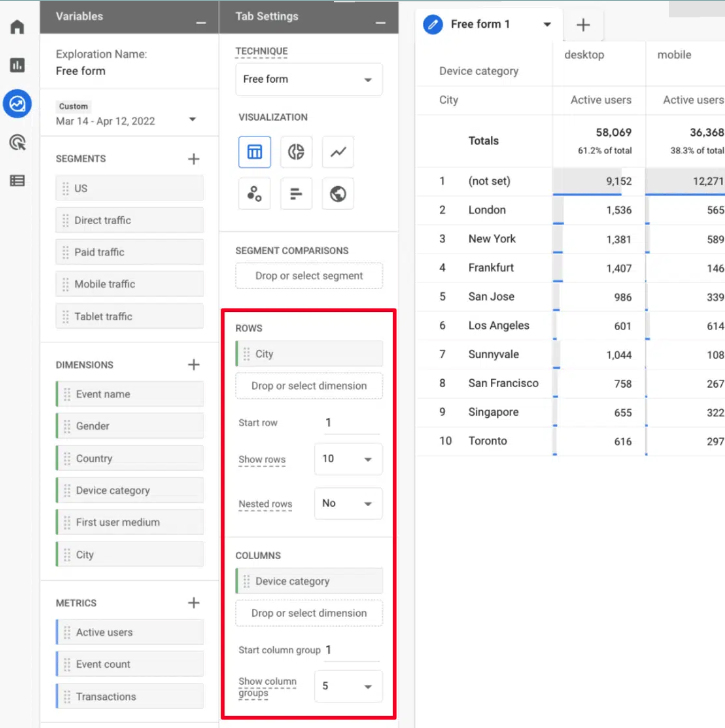
Step 7: Drag & Drop Rows & Columns
In Universal Analytics, you put dimensions into rows and metrics into columns. In GA4, you can add dimensions to either rows or columns to create the in-depth report you need to understand your data.
For example, in the template report Google has made, you can see they’ve added City as a column, then Device category into rows. So, the graph will now show the city and device category for each metric (a.k.a. Value) that’s added (Active users in the example graph).
If you’re new to GA4 Explore reports, we recommend sticking with adding dimensions to rows only at first, then start playing with columns when you’re feeling more confident.
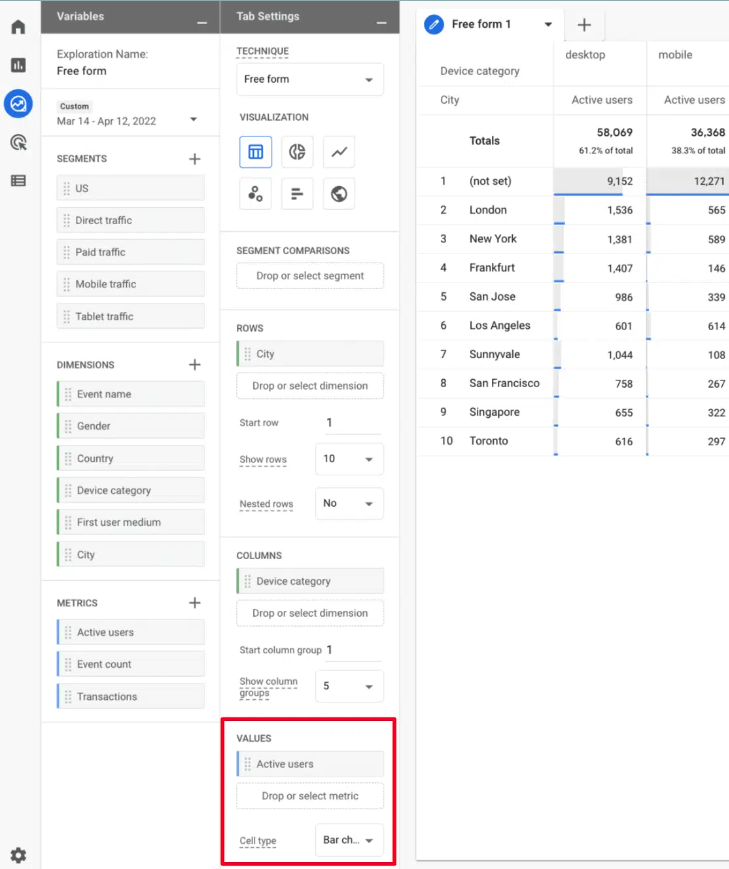
Step 8: Drag & Drop Values
In custom reports in Universal Analytics, you just had metrics. In GA4, this section is called Values. You can only drag and drop metrics into this section. “Values” = numbers.
So, in Google’s example report, active users is the value.
Step 9: Drag & Drop Filters
If you need to filter the data in your report, the Filters box underneath Values is where you can add your filters. You can drag and drop dimensions or metrics into your filters, depending on what you’re trying to set up.
For example, if you’re setting up an event report but you just want to see one certain event, you can drag Event name into your filters box and indicate which event you want to see.
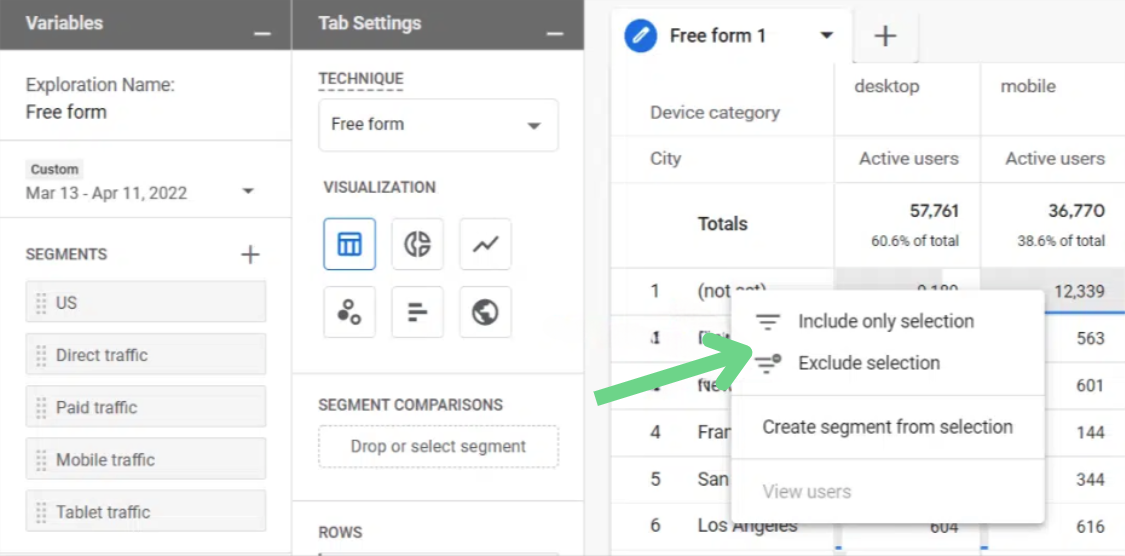
A great feature of GA4 Exploration reports is the ability to filter right from the report graph. Just right-click on an item and click Exclude selection. In this example, we’re filtering out (not set).
Read more articles
Tomahawk Launches Sound Advice for Tourism
By Tomahawk |

We have officially welcomed our newest team member, Chip, an AI-generated T-Hawk with a smooth voice and endless enthusiasm for tourism and digital marketing. Well...technically he isn't that new. Chip was assembled somewhere in...
What's The Difference Between SEO, GEO and AEO?
By Gina Paladini |

If you've been keeping half an eye on the marketing world lately, you've probably noticed a new alphabet soup floating around: AEO, GEO, and good old SEO.
For years, SEO was the only acronym tourism operators needed to know, now...
